
The Situation
Recently, I completed an availability and downtime analysis with a maintenance manager I am coaching. Like many maintenance leaders, he was focused on the things that most of us naturally think about when discussing availability improvement:
- Major component failures
- Fleet reliability issues
- Planned Component Replacement (PCR) programs
- Reducing scheduled servicing time
None of those are surprising areas of focus. In fact, for mobile equipment I usually find the sites are not doing enough scheduled downtime in a structured and repeatable way. As we worked through the analysis together, the data showed something I don’t encounter very often. The fleet had way too much scheduled downtime and too much unscheduled downtime.
When we stepped back and looked at the complete availability picture, the answer became much clearer.
We analysed:
- Availability target
- Scheduled downtime
- Unscheduled downtime
- Downtime event duration (scheduled and unscheduled)
- Scheduled downtime consistency
What surprised him most was how much downtime was sitting inside the smaller unscheduled downtime events and how much the inconsistent scheduled downtime was affecting overall fleet availability.
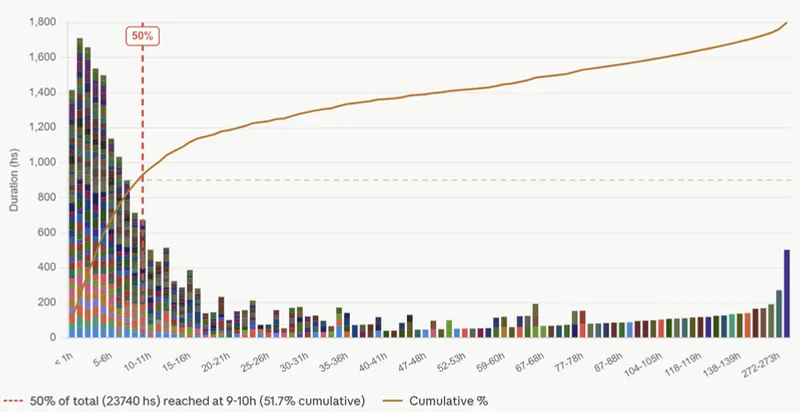
The graph above shows how much downtime is being created by smaller duration events. This is important because these events are usually far easier to eliminate than major failures. The small events often become accepted as “just part of the job” when in reality they are frequently symptoms of:
- Poor work quality/culture
- Poor inspection quality/culture
- Lack of discipline in raising defects that have been identified
- Acceptance of poor standards.
Not major engineering problems or any design changes needed, just execute the current maintenance program well.
The second surprise was discovering that the fleet was carrying both excessive scheduled downtime and excessive unscheduled downtime and perhaps the most interesting insight of all was seeing a clear relationship between the consistency of scheduled maintenance and the amount of unscheduled downtime being experienced. I’ve known for years that consistent scheduled maintenance is one of the foundations of reliability, but this was the first time I had used correlation analysis to quantify that relationship.
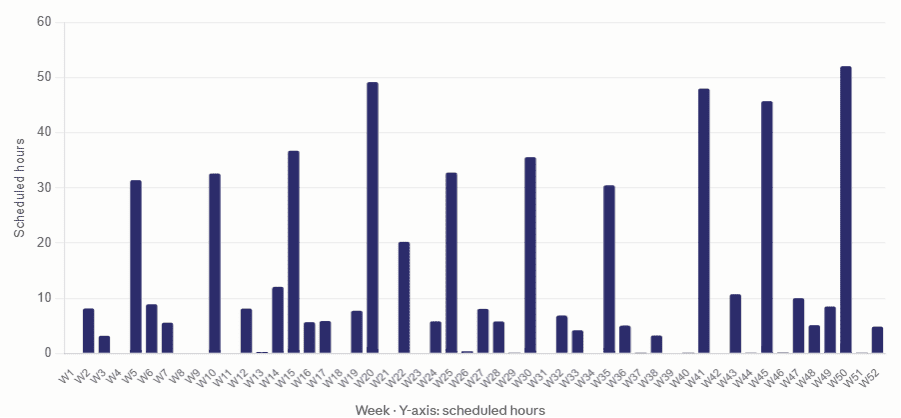
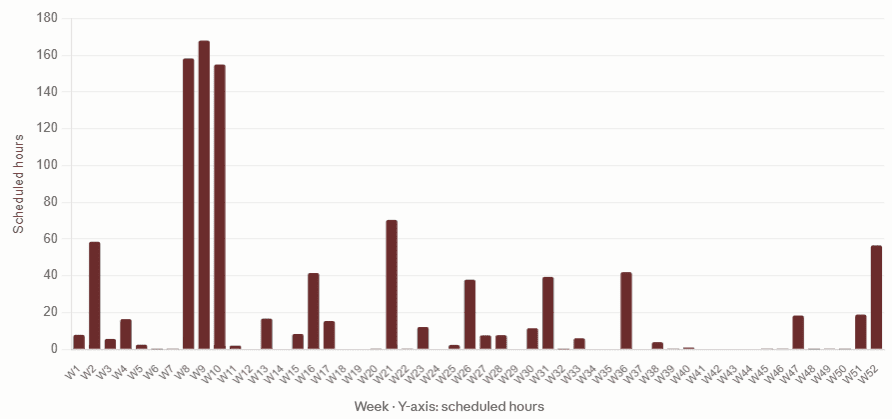
Machines receiving maintenance in a consistent and repeatable pattern experienced significantly less unscheduled downtime than machines with irregular maintenance schedules.
That finding alone helped focus and clarify the direction of the improvement effort.
What Many Sites Do
Many sites focus their attention on the biggest failures. I understand why, a major engine failure, transmission failure or structural issue is highly visible and attracts immediate attention.
As a result, discussions become focused on:
- Major breakdowns
- RCA investigations
- Engineering or design improvement projects
- OEM performance
- Operational damage
Meanwhile hundreds of smaller downtime events continue occurring every month. The irony is that these smaller events are often:
- Easier to eliminate
- More predictable
- More influenced by work quality
- More influenced by leadership and culture
Because they are small, they rarely receive the same level of attention.
At the same time, many sites convince themselves that improving availability means reducing scheduled maintenance. Unfortunately, scheduled downtime is the only tool we have control over to improve reliability. We control how much we do, the quality, and the efficiency of the work completed within these scheduled downtime events.
Reducing it below the required level only creates exactly the opposite outcome, more unscheduled downtime.
The Proven Approach
One of the first exercises we complete in the Maintenance Manager and Superintendent coaching programs is what I call the GAIN Process. The purpose is simple. To make the biggest opportunities for availability improvement obvious so that the actions taken will be effective.
G – Goal Availability
Start by defining what good availability performance looks like and what percentage of downtime should be scheduled.
As a rule of thumb:
- Mobile mining fleets = 60% scheduled and 40% unscheduled @ 90%+ availability
- Fixed plant processing assets = 80% scheduled and 20% unscheduled @ 92%+ availability
- Lower wear process plants = 90% scheduled and 10% unscheduled @ 95%+ availability
Without clear targets, everything risks becoming spur of the moment decision making.
A – Allocate Downtime
Once the availability target is known, calculate the allowable downtime.
For a mobile fleet targeting 90% availability:
- 8760 hours per year
- 876 hours allowable downtime
Then allocate that downtime intentionally.
For most mobile mining fleets, a good starting point is:
- 60% Scheduled Downtime = 525 hours
- 40% Unscheduled Downtime = 350 hours
This immediately creates clarity about how much downtime is available and where it can be spent. We can then build a scheduled downtime strategy to suit.
I – Identify Losses
Now analyse where the downtime is actually occurring.
Ask:
- Is unscheduled downtime dominated by major failures, or is it dominated by smaller repeat events?
- Is scheduled downtime consistent?
- Are we doing too much or too little scheduled downtime?
- Are shutdown intervals too short or too long?
- Are major component replacements consuming too much downtime?
In this recent analysis, approximately 50% of all unscheduled downtime was generated by events of eight hours or less. Those short-duration events represented the easiest opportunity for improvement. That is often where the fastest gains are found.
The scheduled downtime improvements needed to focus on a disciplined application of the scheduled downtime strategy and deliberate reduction in the major component replacement through improved planning and efficiency.
N – Narrow the Gap
Now the improvement priorities become obvious. For this particular fleet, the opportunity was not hidden inside a major engineering project.
The opportunity was sitting in:
- Eliminating smaller repeat failures by improving maintenance quality and enhanced standards
- Start with the top 5 from the pareto
- Following a consistent scheduled downtime strategy
- Reducing inefficient component replacement downtime
The analysis showed exactly where effort should be focused and as the decisions were data driven there is 100% confidence they will be successful.
Scheduled Downtime Still Matters
One of the biggest mistakes I see is organisations trying to reduce scheduled downtime without understanding what that downtime is achieving. I thought this warranted its own note.
Scheduled downtime exists to:
- Repair defects before failure
- Complete inspections
- Restore equipment condition
- Clean equipment and apply a proactive approach
- Complete preventative maintenance
For mobile equipment, I generally like to see access to the machine every 2–3 weeks. If the interval becomes too long, defects begin to accumulate faster than they can be removed.
For fixed plant, I prefer to have at least monthly access to key assets. I often see businesses extend shutdown intervals from 12 weeks to 18 weeks believing they are reducing downtime. In reality, they frequently increase total downtime because the increase in unscheduled downtime exceeds the scheduled downtime they saved.
The Principle
Most sites already have enough data to know how to improve availability. The challenge is not collecting more data. The challenge is organising the data so the priorities become obvious.
When you separate Scheduled downtime, Unscheduled downtime, Large failures and Small failures and apply the principle that we only have control of the scheduled downtime that we do, then the path forward usually becomes very clear.
Action From This Week
Apply the GAIN Process to one fleet or major asset this week.
G – Goal Availability
What availability should this asset realistically achieve?
A – Allocate Downtime
How much scheduled and unscheduled downtime can you afford?
I – Identify Losses
Where is the downtime actually occurring?
N – Narrow the Gap
What are the few actions that will close the gap?
You will discover where the next 3–5% improvement in availability is hiding and it will be easier to obtain than you think.